Demand Forecasting for CPG: Practitioner Perspectives.
From signal fusion methodology to S&OP process design — written by supply chain practitioners, for supply chain practitioners.

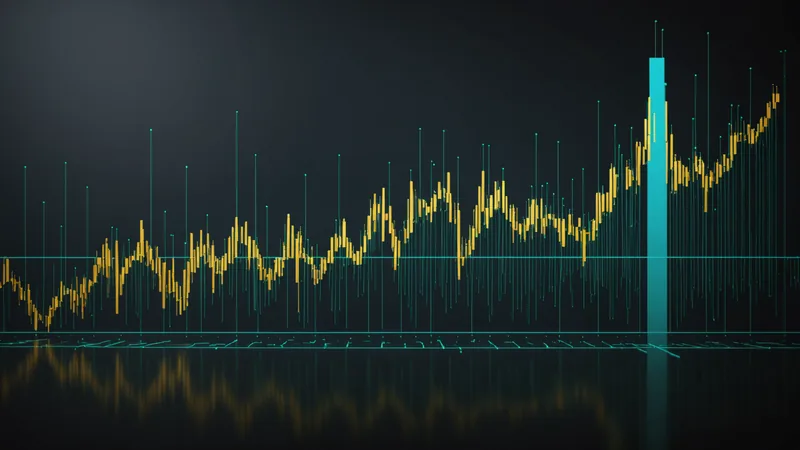
How Macro Economic Indicators Shift CPG Basket Composition (And What to Forecast)
CPI spikes don't reduce total grocery spend — they shift it. Understanding which macro indicators predict trade-down behavior within your category allows supply planners to pre-position mid-tier SKUs 6-8 weeks before the shift shows in POS.
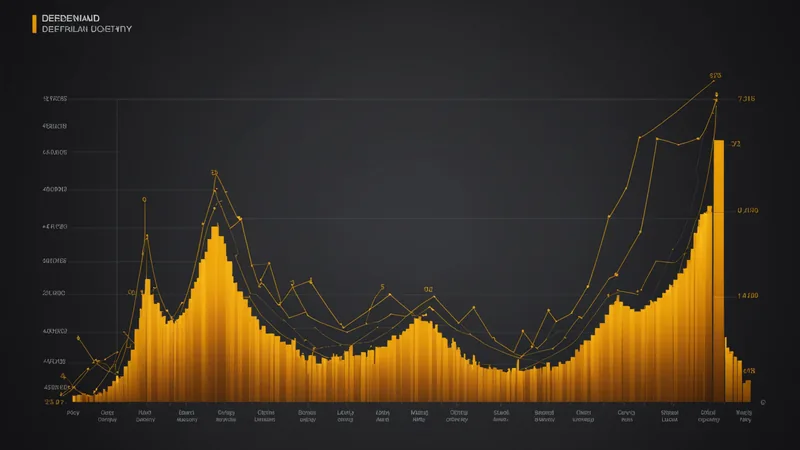
Inventory Optimization for Trending SKUs: The Window You Have Before the Spike Peaks
Trending SKUs have a demand window of 4-8 weeks before the spike peaks and mean-reverts. Missing that window with a stock-out is a permanent revenue loss — the demand doesn't wait for your next replenishment cycle.

Multi-Channel CPG Demand Forecasting: How Signal Fusion Changes Across DTC, Grocery, and Club
The social trend signal that moves your DTC channel in week 1 takes 3 more weeks to cascade into club channel. Multi-channel demand forecasting requires channel-specific signal lag calibration — not a single unified model applied across all distribution.
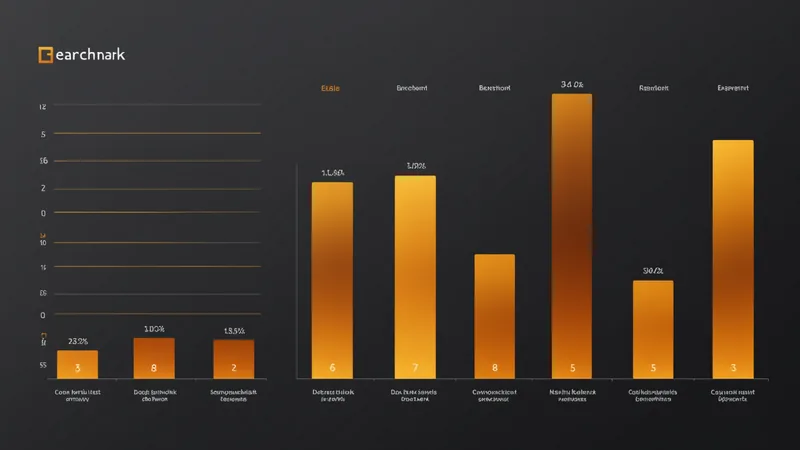
CPG Forecast Accuracy Benchmarks: What Good Looks Like at Each Planning Horizon
4-week, 8-week, and 12-week forecast accuracy benchmarks look very different. Understanding the realistic accuracy ceiling at each horizon tells you whether your model has improvement headroom — or has already reached its structural limit given available data.
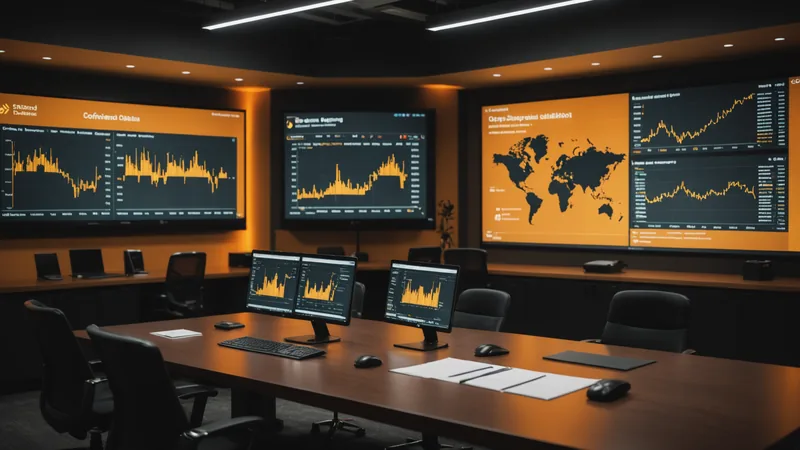
Bringing External Signal Data Into Your S&OP Review: A Meeting Prep Template
Your monthly S&OP review still runs on last week's POS report. This template shows how to surface external signal deviations alongside ERP baseline — in a format your commercial team can act on, not just acknowledge.

Social Trend Velocity and SKU Forecasting: Reading the Signal Before It Hits POS
A sparkling water SKU saw a 340% demand spike driven by social media — and POS data didn't show any movement until week 3 of a six-week demand window. Social trend velocity can detect that signal 3-4 weeks before retail data confirms it.
Weather-Demand Correlation in Beverages: A Category-Level Analysis
Hot tea, iced coffee, sparkling water, sports drinks — each category has a different weather-demand correlation coefficient and a different lag from weather event to demand response. Knowing both is the prerequisite for weather-signal forecasting.
Safety Stock Formula for CPG: Why the Classic Equation Underperforms on Trending SKUs
The standard safety stock formula was designed for stationary demand distributions. Trending SKUs driven by social velocity violate those assumptions — and holding safety stock sized for stable demand leaves you undersupplied exactly when you can least afford it.

External Signals in CPG Demand Planning: A Practical Guide
Weather, social trends, and macro indicators aren't exotic additions to a demand model — they're the drivers your ERP is structurally unable to see. This guide covers how each signal category behaves in practice across different CPG categories.
Why Your ERP Forecast Accuracy Is Stuck at 70% (And What's Missing)
Most CPG demand planners report ERP model accuracy in the 65-75% range on a 12-week horizon. This isn't a calibration problem — it's a structural data gap. Here's what POS-only forecasting cannot see, and why adding more history to the same model won't fix it.